Visualization of Climate Data
2024-11-11
Table of Contents
Introduction
Climate data for locations around the world can be found on sources such as Ladybug - EPWmap. These data points are crucial for the home design process, helping to ensure comfort and energy efficiency.
Tools for Climate Data Visualization
Several tools can visualize this data effectively. Below are some recommended tools:
CBE Clima Tool
The CBE Clima Tool allows the visualization of climate data without requiring installation. It provides various visualization options to help understand the climate conditions of a specific location.

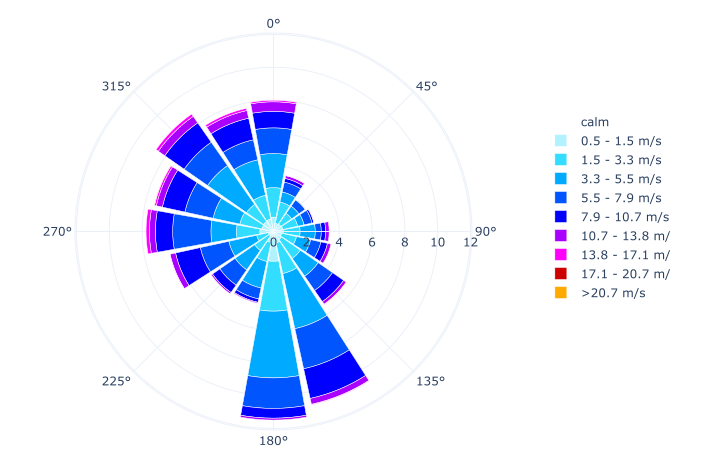
For example, this graph explains the following:
The wind rose chart shows that winds are predominantly southerly and westerly, with most wind speeds being light to moderate, and only occasional high winds.
Climate Consultant
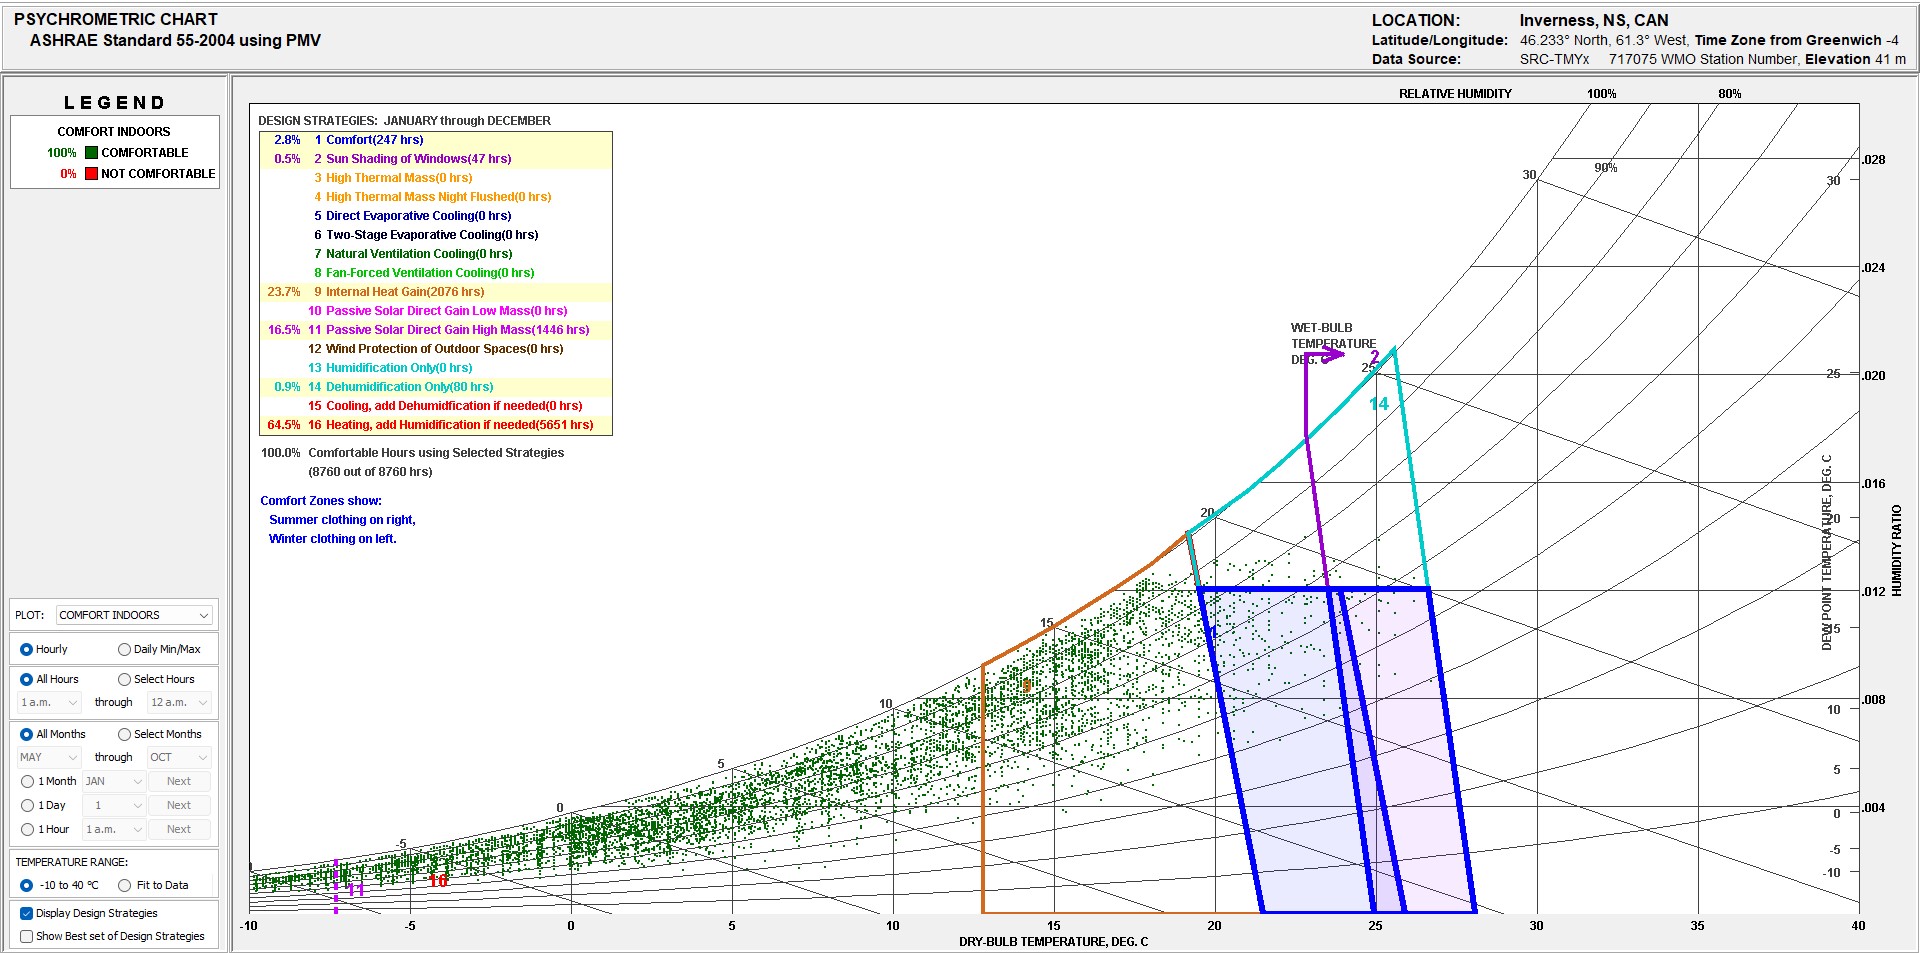
The Climate Consultant tool not only visualizes climate data but also provides design suggestions to ensure comfortable living conditions. It is a comprehensive tool for architects and designers.

Conclusion
Using these tools, you can gain valuable insights into the climate conditions of your location, which can inform better design decisions for your home. Proper climate data visualization can lead to more comfortable and energy-efficient living spaces.